To get up and running with usage of SmartiPlot, this guide will be all you need. Details of all of the configuration options for different types of graph or plot are not listed for reasons of brevity, see the options configuration page.
Opening the app allows selection of one of the different types of data visualization. The pictorial icons to the left of the screen give an indication of the type of graph or plot and there is a description below; once this choice has been made there is no further opportunity to change it without starting over.
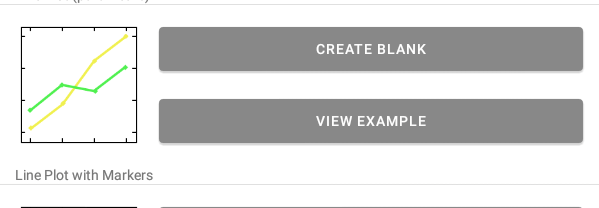
Each variant can be selected with either “Create Blank” or “View Example”. The first of these creates an empty table in a new view, while the second allows examination of a populated table and has the subsequent options screen populated and configured. When experimenting with the app, choosing “View Example” is suggested as a way of becoming familiar with the table and options screens, but an experienced user would probably want “Create Blank”.
The table view is laid out much like a conventional spreadsheet, with column titles across the top and row numbers down the left-hand side. The first task with a blank table is setting the number of rows from a dialog box, which is opened by selecting “Index” at the top-left of the table. (When a table has non-zero rows, clicking on any row number also opens this dialog.)

The middle button near the bottom of the table screen allows addition of new columns to the right of the table. Activating it opens a dialog where you can enter the column title (for a “Number” or “Text” column), variable name and numerical limits (for a “Range” column), or a variable name and mathematical formula (for a “Formula” column). (Hints are shown for each of these when the entry is blank.)
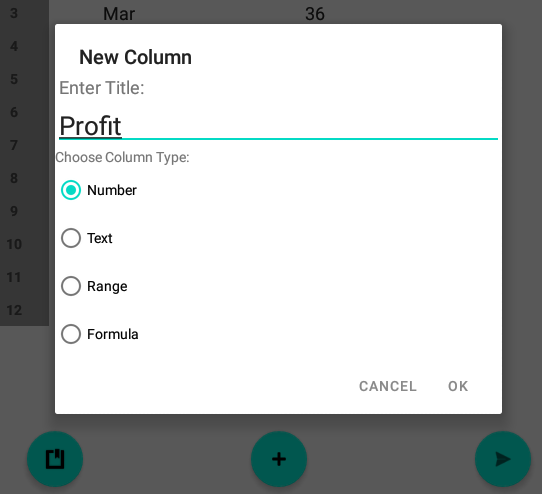
This title can later be changed by selecting the column heading to open a dialog, and the column can be deleted altogether from the same dialog.

The types of column and their intended uses are as follows:
- Number: Intended for manual input of integer or floating-point numbers. If the number of rows is changed, this data may be truncated and cannot be recovered.
- Text: Intended for manual input of textual data, such as months of the year. If the number of rows is changed, this data may be truncated and cannot be recovered.
- Range: The variable name is necessary and can optionally be used on the right-hand side of subsequent “Formula” columns. The limits of the range must be comma-separated numbers enclosed in square brackets, and the column is auto-filled with intermediate values. If the number of rows is subsequently changed, the whole column is recalculated.
- Formula: The variable name is optional while a formula referencing variables from “Range” or “Formula” column(s) to the left of the column must be written. The column is auto-filled upon entry of a valid formula. If the number of rows is subsequently changed, the whole column is recalculated.
The left-hand button near the bottom allows import of a CSV (Comma-Separated Value) file from the device’s storage into a new table. The types of each column will be either “Number” or “Text” depending upon the data types used in the CSV file. The right-hand button changes the screen to a new view from where the graph or plot options can be configured.
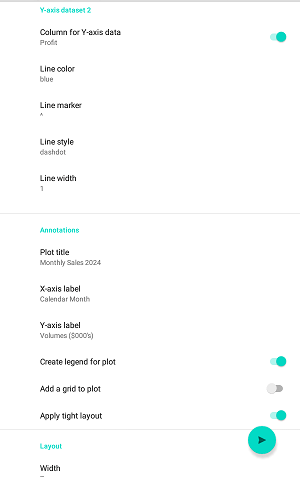
When using the options screen it is important to recall which graph or plot type has been selected, as well as the names of the data columns as these are used to configure the visualization; in case of uncertainty it is possible to go back to the table view, preserving all currently set options, by using the back icon or “swipe left” depending upon your device’s OS version. The options are laid out by category; the last two categories “Annotations” and “Layout” are common to all of the graph or plot types. When you are satisfied with the option configurations the button at the bottom-right of the screen opens a new view showing the graph or plot.
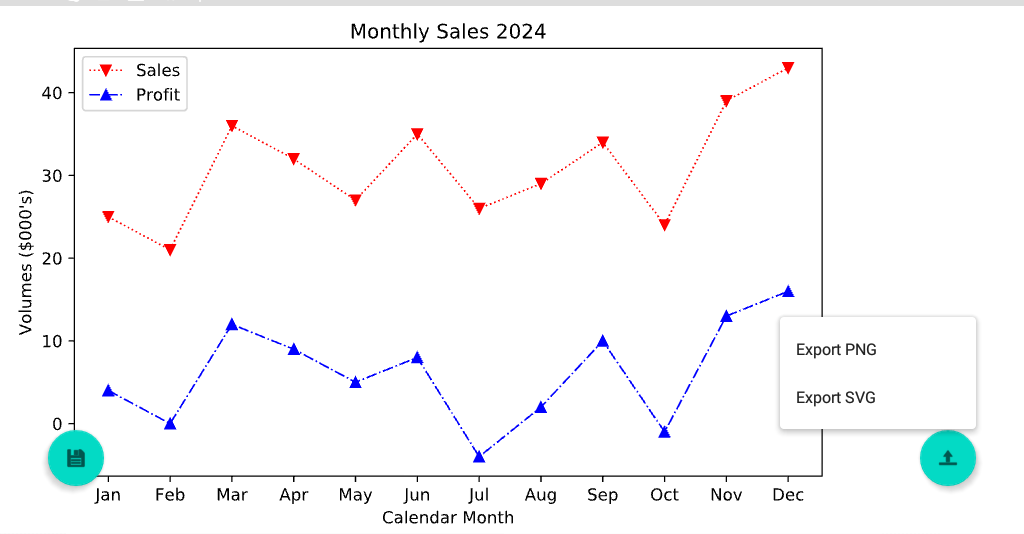
When viewing the completed plot, it is possible to zoom in or out with pinch gestures, and to scroll the view horizontally or vertically should it be bigger than the screen. The button at the bottom-left of the screen saves the table and all options to within the app, which can be selected and modified at some future time from a list at the bottom of the choice screen when the app opens.

The button at the bottom-right of the screen allows export to the device’s storage as either an SVG (Scalable Vector Graphic) or PNG (Portable Network Graphic).